Saturday, October 31, 2015
Representativeness and significance of analyses

You regularly hear the terms "representative samples" and "significant results". However, when you analyze your results, these concepts seem abstract. In this post, we offer a reminder of these two statistical concepts, to help you interpret and make the best use of your results.
Representativeness of your results
Rarely can a survey be administered to all the individuals in a population. Therefore, a sample must first be drawn [1].
A sample is said to be representative when it possesses the same characteristics as the parent population, characteristics deemed to be discriminating of the population. These characteristics depend on the sector in which the survey is carried out.
A company offering BtoB services will focus on the sales and sector of its customers, while a company operating in a BtoC market will prefer to work on the characteristics of its consumers (gender, csp, age range...).
Example
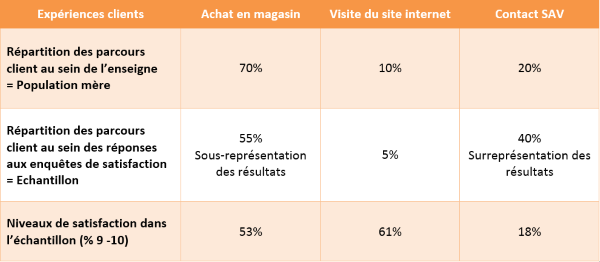
The sample of respondents is not representative of the parent population, which includes 20% of "SAV contacts". If we retain the respondent base without any statistical operation, the results of the "After-Sales Contact" will have a greater weight than in reality. The results will be directly impacted by the poor SAV results.
Overall satisfaction level without adjustment =39.4
Overall satisfaction level with adjustment = 52.6
In the case of self-administered surveys, whose returns depend on the "goodwill" of individuals, any analysis must begin by checking that the sample obtained is representative. If this is not the case, it may be necessary to adjust the results before interpreting them.
Significance and Confidence Interval (CI)
When you work on a sample, you obtain an "estimate" of the phenomena existing within the parent population. So, unwittingly, you accept that you're working with a margin of error, the gap between the satisfaction levels of the sample and the levels observed in reality.
The margin of error (or confidence interval) is measured from :
- sample size: the larger the sample, the more accurate the measurement
- a significance threshold: level of confidence in the results
The significance level lets you define the degree of certainty with which you obtain your results. If your figures are declared significant at 95%, this means that your results are within the confidence interval with 95% certainty. In other words, there is a 5% risk that your results will fall outside the calculated confidence interval.
Generally speaking, a significance level of 5% is used to declare results as significant. However, when estimating human behavior/perceptions, results for which the significance threshold is between 5% and 10% should not be ignored.
The common statistical rules used to calculate the significance level apply to large samples. Below 30 respondents, the parameters are no longer exploitable according to statistical laws. That's why Sharing-Data offers you an annotation to help you read and interpret the results.
Sample size, an operational illustration
You want to conduct a telephone survey. For cost reasons, you don't want to canvass your 1,000 customers. Use the chart below to define your optimal sample size, based on the margin of error and the level of confidence you consider acceptable. The higher your precision requirements, the larger the sample size.
To obtain a result with a confidence level of 95% and a margin of error of 2%, it will be necessary to validate 706 surveys.
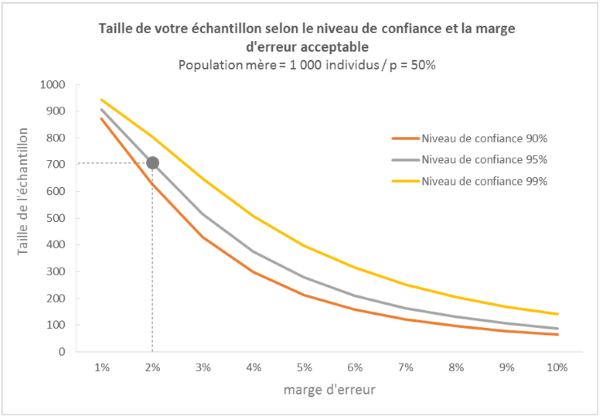
The larger the sample size, the more accurate the measurement.
[1] There are a number of different sampling methods, each with its own advantages and disadvantages.
[2] To adjust a sample, we assign a weight to each respondent according to the stratum to which they belong. If 50% of respondents belong to stratum A, whereas it represents 70% of the parent population, we will assign a weight of 70%/50% to each respondent in stratum A.
[3] Formula [3] is written :
![]()
with f = measurement of the phenomenon
n = sample size